Excalibur Pair Trading Primer #1A - Transparency
- rickstine
- Sep 7, 2022
- 1 min read
Updated: Sep 8, 2022
Last week, we showed you how to backtest a pair trade between the Euro and the Polish Zloty. On our website, you could view on our graphs when a trade was to be entered, what kind of long/short trade would be entered and when the trade should exit. And in an accompanying graph, we should you the returns from the trade.
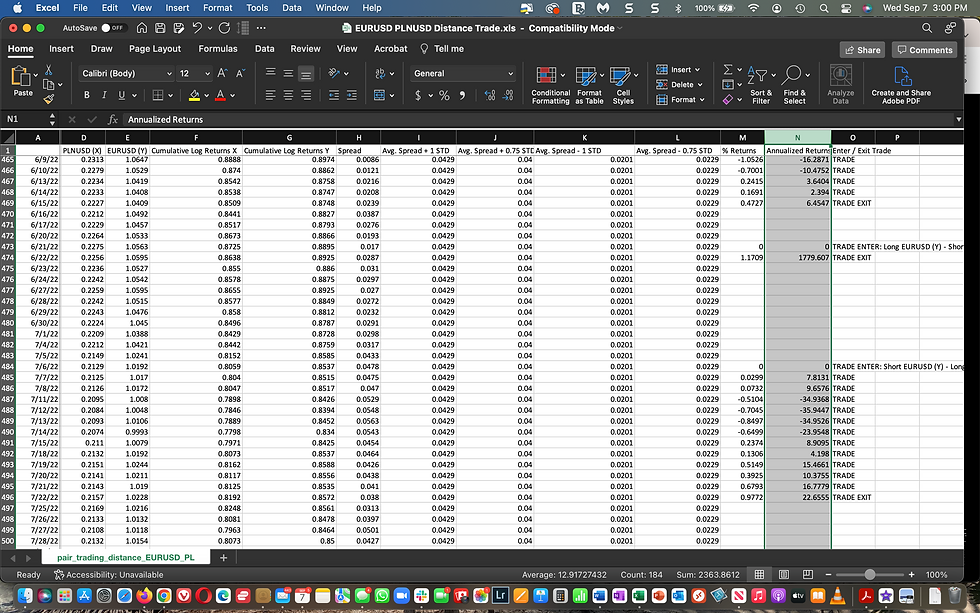
We also provide the ability for you to dig more deeply into the trade through a downloadable Excel spreadsheet. When you click the .CSV button on the website next to the graphs, in seconds you have this spreadsheet.
What does it show? All of the data and calculations behind the "Distance" statistical arbitrage strategy so you can see exactly what is behind the potential trades. In the "Distance" strategy, we look at cumulative log returns of each instrument and then the spread between those returns. We then compute an average spread and measure standard deviations above and below the average (the triggers that you have selected). On the spreadsheet, we are showing daily data of how the current spread compares with the average/standard deviation spreads. We then show when a trade was entered, exited and the returns (for each day). We are also showing the daily values of the instruments involved in the trade.
Give it a try:
Kommentare